
Hydro Bill Comparison Excel Template (2026)
0
Free download
Track capital gains, inclusion rate, taxable gains, and holding periods for Canadian transactions in one workbook.
Download template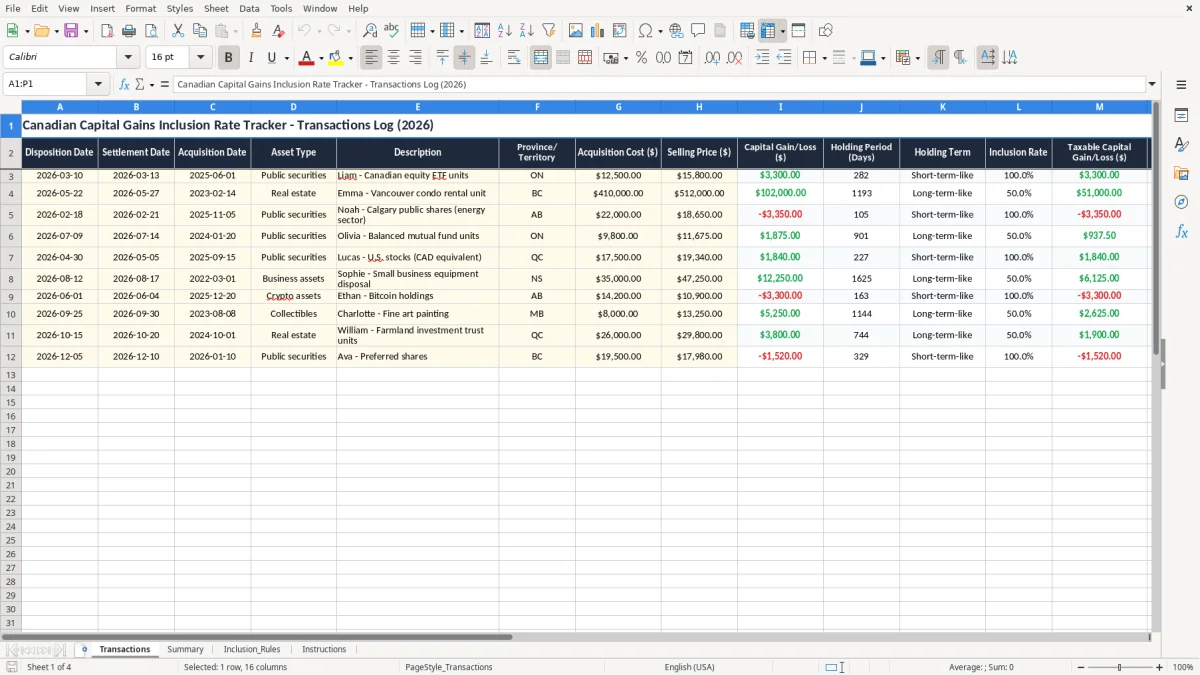
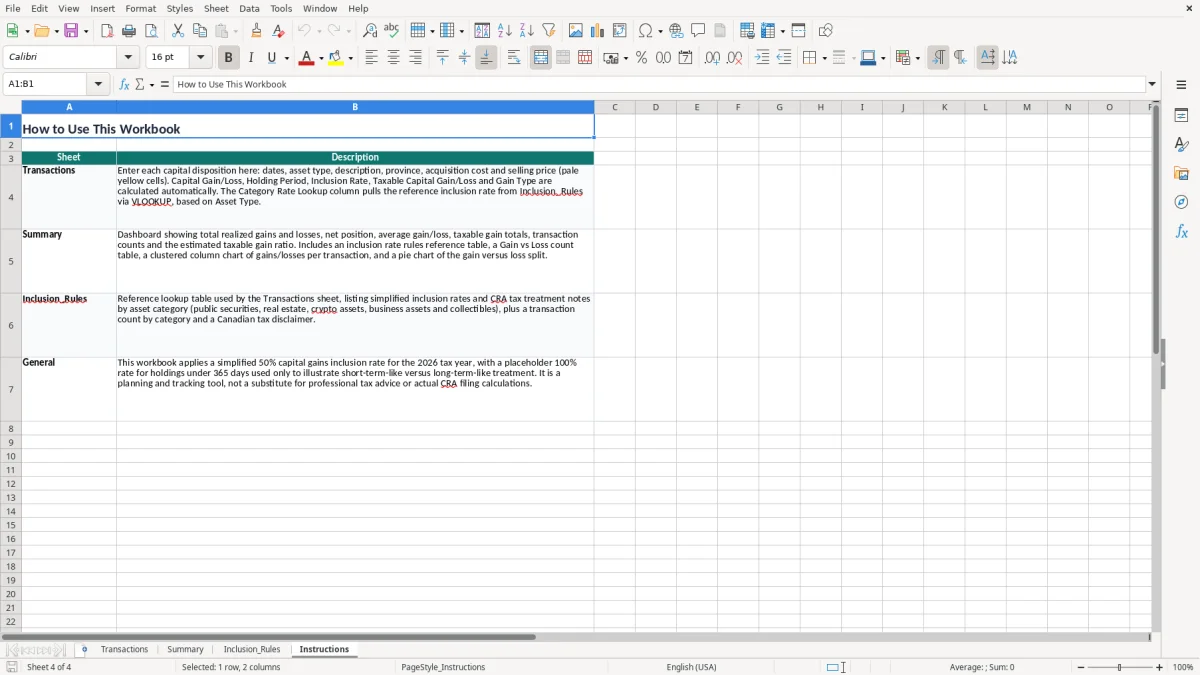
This Capital Gains Excel spreadsheet helps you track each disposition, calculate the gain or loss, apply the inclusion rate, and see the taxable capital gain in one place. It includes a Transactions log, Summary dashboard, Inclusion_Rules sheet, and Instructions sheet.
Use it when you sell shares, crypto, or other capital property and need a clean record for your tax file. The workbook is built for Canadian reporting, so you can keep the dates, cost base, proceeds, and inclusion rate together without rebuilding the math every time.
For a small investor with 12 trades in a year or a sole proprietor selling an old business asset, that matters fast. One missed acquisition date or wrong proceeds figure can change the taxable amount by hundreds of dollars.
You use this workbook when you need a clean record of each disposition, not just a rough list of trades. A sole investor with 8 share sales, a bookkeeper at an incorporated company disposing of equipment, or a family reporting a cottage sale can all use the same structure to capture cost base, proceeds, and holding period.
The pressure usually shows up at year-end or when you are preparing a T1 return and need to reconcile what was sold. If you sold 6 positions at $4,500 each and one of them has a $1,200 gain, you want the taxable portion visible immediately instead of reworking it in a calculator.
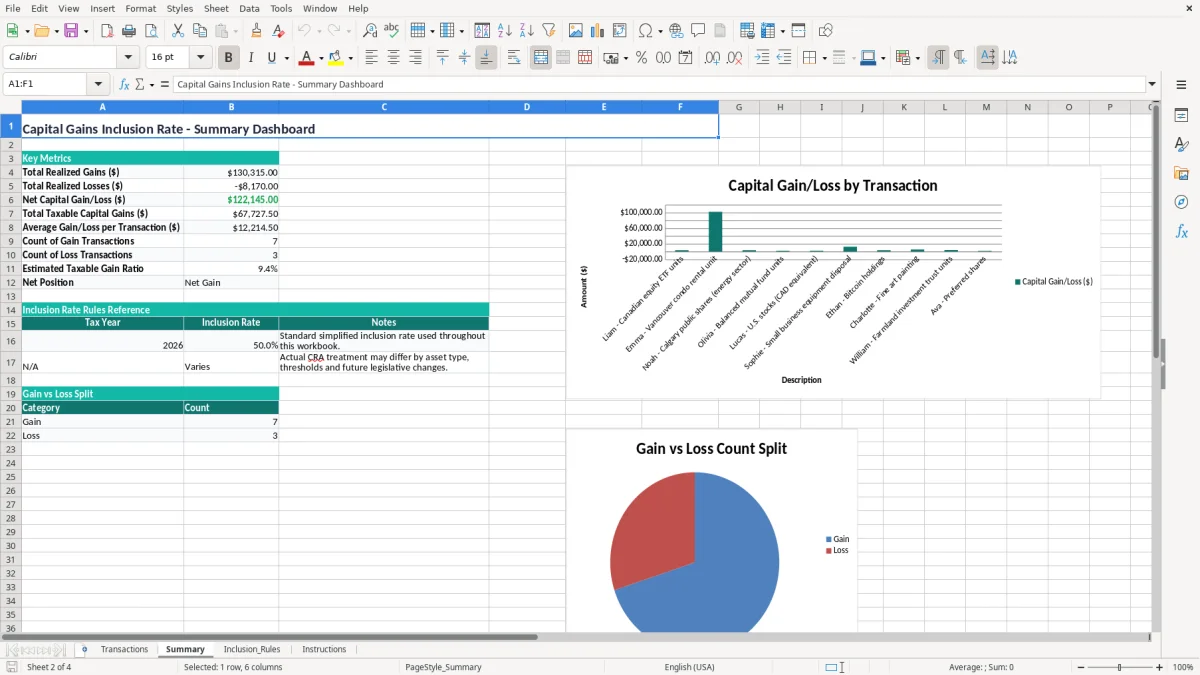
The Transactions sheet gives you one line per event, which is the right way to handle a portfolio with mixed dates and asset types. The Summary sheet is there for the quick check: if your gains total $18,000 and losses total $7,500, you can see the net exposure before you hand the file to your accountant or file yourself.
Once the net exposure is clear, the next year’s filing is easier to line up with your RRSP contribution room tracker so the deduction side and the capital gains side stay in sync.
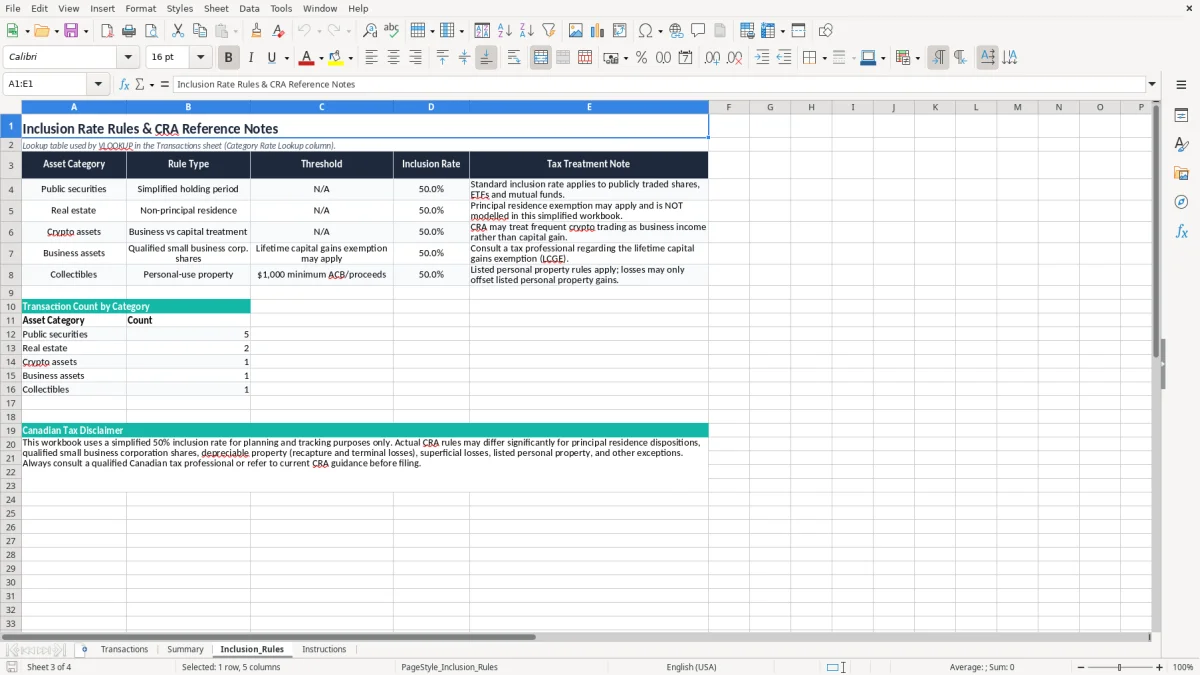
The CRA expects you to keep enough detail to support the adjusted cost base, proceeds of disposition, and the resulting gain or loss. For Canadian tax reporting, capital gains are generally reported at the inclusion rate in effect for the year, and the workbook’s rule table is there so you can apply that rate consistently instead of guessing row by row.
You should keep supporting records for at least the CRA’s six-year retention period. That means acquisition confirmations, sale confirmations, broker statements, and any notes showing why a row was included at a specific rate.
If a transaction has a $10,000 capital gain and the applicable inclusion rate is 50%, the taxable capital gain is $5,000. If the rate changes and you fail to update the workbook, the error flows straight into your return and can distort both tax payable and instalment planning.
This is why the Inclusion_Rules sheet is more than a reference tab: it keeps the rate visible when you are working through several sales in the same month. A small investor with 15 rows can stay accurate without rebuilding formulas in a separate tax calculator.
That same trail of sales also belongs in an ACB tracker, so the gain calculation and cost base stay aligned as each disposition is added.
The biggest mistake is using the wrong cost base, especially when fees and commissions are left out. If you bought shares for $12,000 and paid $45 in trading fees, then sold for $14,000, that $45 changes the gain and should not be ignored.
Another common problem is mixing up disposition date and settlement date. A sale that closed on 2026-03-10 but settled on 2026-03-13 may not change the economics, but it can affect the way you document the event and the order in which rows appear in your records.
One wrong row can distort the whole summary. If you understate gains by $3,000 and the marginal tax impact is roughly 25% to 35% in your bracket, that is $750 to more than $1,000 in tax error before interest or reassessment work.
People also forget to separate capital and income treatment. A frequent trader with 40+ short-term sales may not be dealing with capital gains at all, so the spreadsheet should be used with a clear tax position rather than as a blanket substitute for proper reporting.
The easiest way to keep this workbook useful is to update it on the same day you get the trade confirmation or sale notice. If you wait until March, you will spend an afternoon chasing down missing acquisition dates and broker statements.
If you are handling hundreds of trades, multiple accounts, or complex corporate reorganizations, the workbook becomes a review tool rather than the main system. At that point you usually need brokerage exports, a proper tax package, or accountant-reviewed schedules to keep the data reliable.