
Condo Board Operating Budget Excel Template Canada
9
Free download
Track program revenue, allowable expenses, margins and estimated AgriStability benefits for Canadian farm operations in 2026.
Download template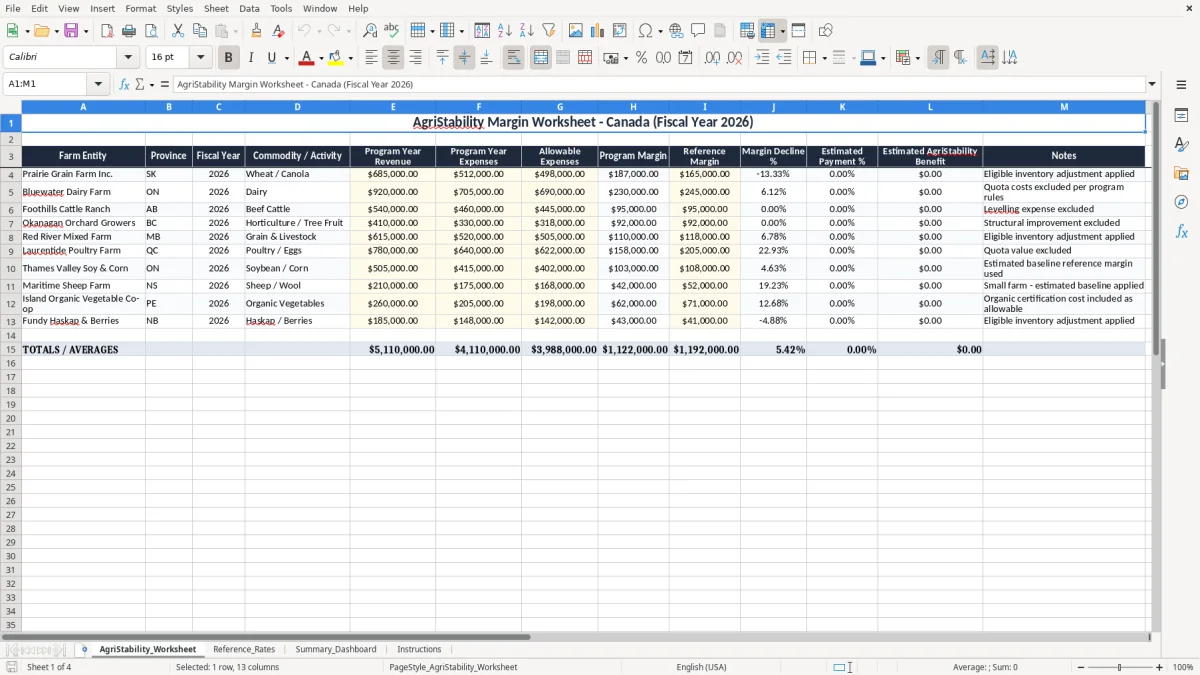
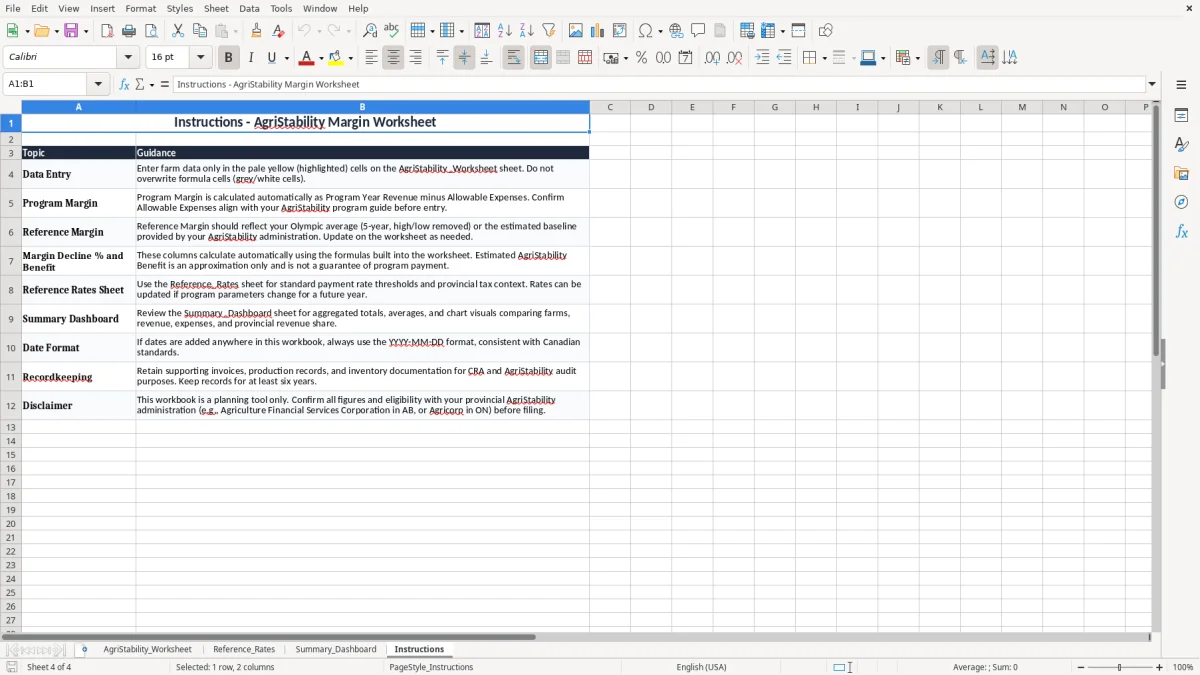
This AgriStability margin worksheet Excel template helps you compare program revenue, allowable expenses, program margin and reference margin for Canadian farm operations in 2026. It includes an input worksheet, a reference rates sheet, a summary dashboard and instructions.
You use it when you need a quick view of likely AgriStability support before filing, planning cash flow, or reviewing year-end results. The workbook is set up for farm-level entries, with estimated benefit calculations and a dashboard that condenses the numbers into one page.
The sheet structure matches the way farm records are usually reviewed at year-end: by farm entity, province, commodity and margin position. That makes it practical for a sole operator, a farm bookkeeper, or a family farm corporation preparing for the next program cycle.
The people who reach for this workbook are usually the ones closing a farm file, not the ones reading a policy guide. A sole proprietor in Saskatchewan, a controller at a family farm corporation in Ontario, or a bookkeeper for a mixed operation in Manitoba can use it when the numbers start changing at year-end.
In AgriStability_Worksheet, you can see farm entity, province, fiscal year, commodity or activity, program year revenue, program year expenses, allowable expenses, program margin, reference margin, margin decline, estimated payment and notes. Image 1 would be the working sheet you update row by row, which is the way most farm offices review 3 to 10 operations at once.
A farm with 4 employees, $685,000 of revenue and $498,000 of allowable expenses needs a clean margin comparison before the file goes to the advisor. A dairy operation with $920,000 of revenue and a $245,000 reference margin is not looking for theory; it is looking for a fast answer on whether the current-year drop is large enough to matter.
Farm records are often spread across crop statements, livestock sales, input invoices and bank transactions. Putting those numbers into one worksheet cuts the time spent hunting through statements and helps you spot a bad commodity row or a missing adjustment before the filing deadline.
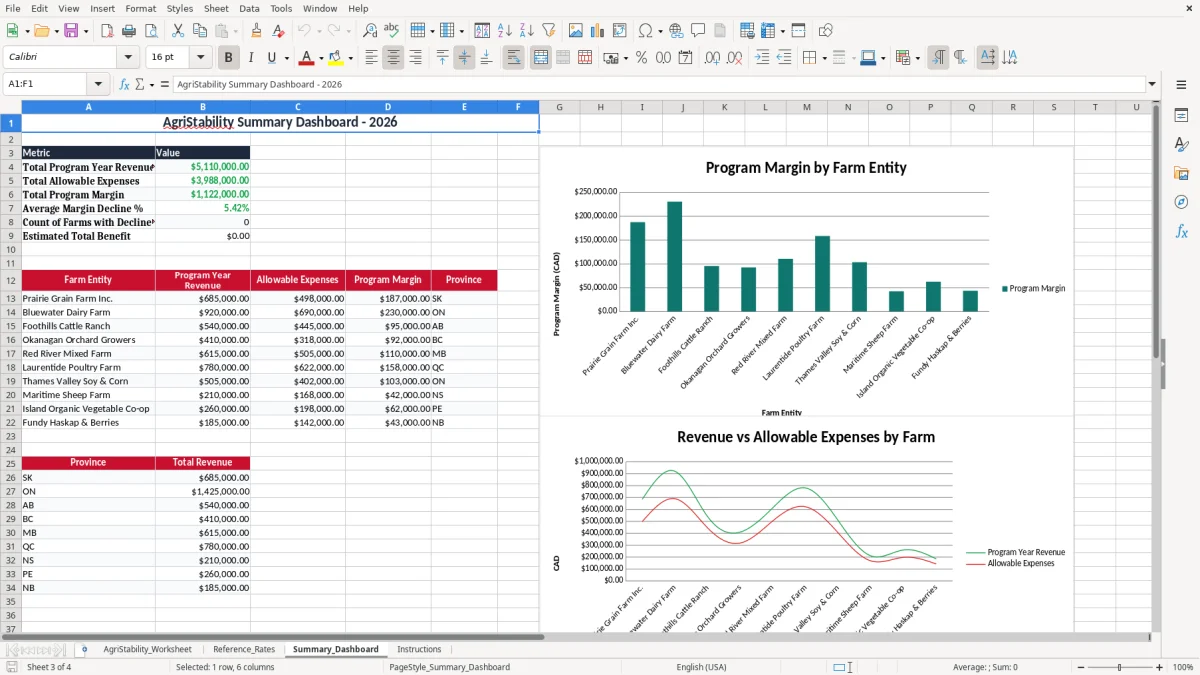
This workbook is built around the Canadian AgriStability style of margin review, where you compare a program-year margin to a reference margin and estimate the benefit from the decline. In practice, a 2026 farm file may show a $187,000 margin on one operation and a $95,000 reference margin on another, which is why the template keeps both figures visible in the same row.
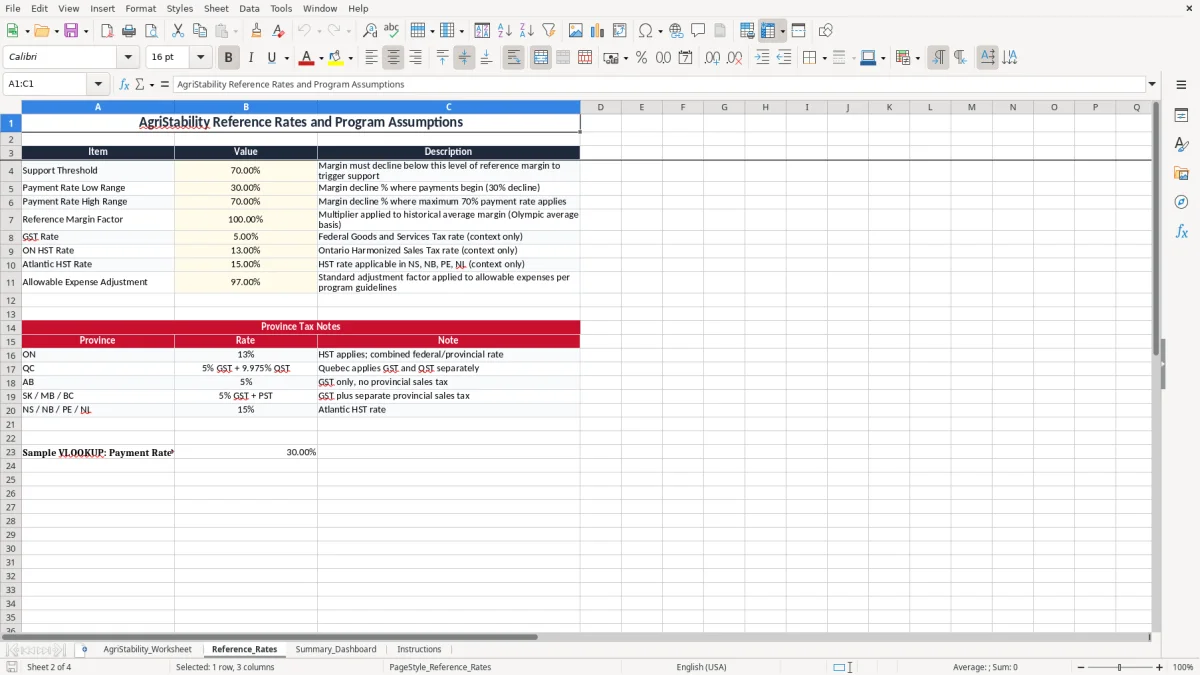
The Reference_Rates sheet supports the input sheet by keeping assumptions in one place instead of scattering them across formulas. That is the safer way to work when you are reviewing multiple farms, because a single rate change can alter the estimated benefit on every line.
For many farm businesses, the worksheet is part of the same close process as the income statement, balance sheet and tax file. A farm corporation may need the numbers ready for internal review before the year-end package is completed, while a sole proprietor may use the sheet to line up figures for the T2125 business schedule.
If you are handling 6 farms and each one uses the same assumptions, a central rate table avoids accidental mismatches. That matters when the difference between two rows is only a few percentage points, because a small formula error can change the result by thousands of dollars.
The first problem is mixing eligible and ineligible items in the same row. If you include a $20,000 structural improvement or a quota cost that should not be in the allowance calculation, your margin can look stronger than it really is, and that can distort the estimated payment by a meaningful amount.
The second problem is a bad reference margin. A farm that should be measured against $245,000 but is entered at $225,000 will show a deeper decline than it should, which can easily move the expected benefit by several thousand dollars.
Bookkeepers also lose time when each commodity is entered differently. One row says wheat and canola, another says grains, and a third says crop sales, so the dashboard becomes harder to read and the owner has to ask for a second pass.
Another common mess is a spreadsheet left without notes. If the file shows a $330,000 expense total but no comment explaining an excluded item, the next person has to reverse-engineer the whole row, which is the kind of work that turns a 20-minute review into a 2-hour one.
On a farm with five rows and an average benefit swing of $3,000 per row, one bad assumption can push the estimate off by $15,000. That is enough to affect supplier payments, operating credit planning and the timing of draws before the next crop cycle.
That same kind of cost drift also needs a capital cost allowance schedule to separate depreciable assets from operating expenses before the next crop cycle.
This spreadsheet works best when it is tied to a fixed farm-office habit, not to a vague promise to update it later. The easiest pattern is to touch it during the same week you finish the year-end file or review the crop and livestock statements.
Once you are dealing with 15 to 20 farms, or you need to import statements from accounting software instead of typing them, the spreadsheet starts to get thin. At that point, move the data capture into a proper farm management or bookkeeping system and keep this workbook as the review layer.