
GST/HST Credit Tracker Excel Template – Free (2026)
2
Free download
Track Canadian provincial sales tax, GST, HST, PST and QST by transaction with editable 2026 rates, formulas and a province summary.
Download template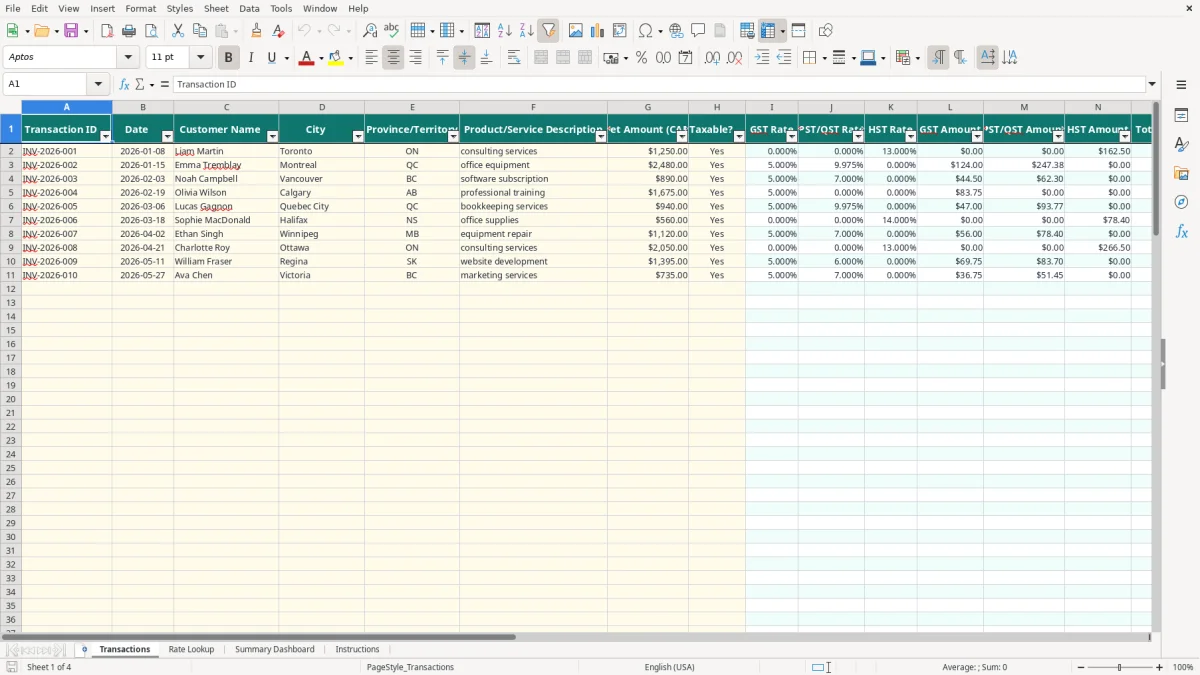
This provincial sales tax Excel template records invoices by Canadian province or territory and calculates GST, PST/QST, HST, total tax and invoice totals. It contains 100 prepared transaction rows, an editable Rate Lookup sheet for 2026 rates, a Summary Dashboard and instructions.
Enter one sale per row on the Transactions sheet. The workbook uses the selected province, the Taxable? choice and the rate table to calculate the tax components automatically, while the dashboard summarizes sales and tax by province.
A sole proprietor selling services across Canada may need to review tax by destination, not simply by the location of the business. An office manager at a trades company, a bookkeeper for an incorporated distributor and a volunteer treasurer selling merchandise can all use the Transactions sheet to keep the invoice trail together.
Image 1 shows the Transactions sheet. Its input fields run from Transaction ID through Taxable?, followed by calculated rate, amount, total and note columns. A Toronto consulting invoice for $1,250, for example, can be entered with ON and Yes; the workbook then retrieves the Ontario rate row and calculates the tax columns from the $1,250 net amount.
The layout is particularly useful when one month includes customers in different jurisdictions. Imagine an online store with 300 orders: 80 shipped to British Columbia, 100 to Ontario, 60 to Quebec and 60 elsewhere. Recording the province code on every row gives the dashboard a traceable basis for comparing sales and tax rather than relying on a single blended percentage.
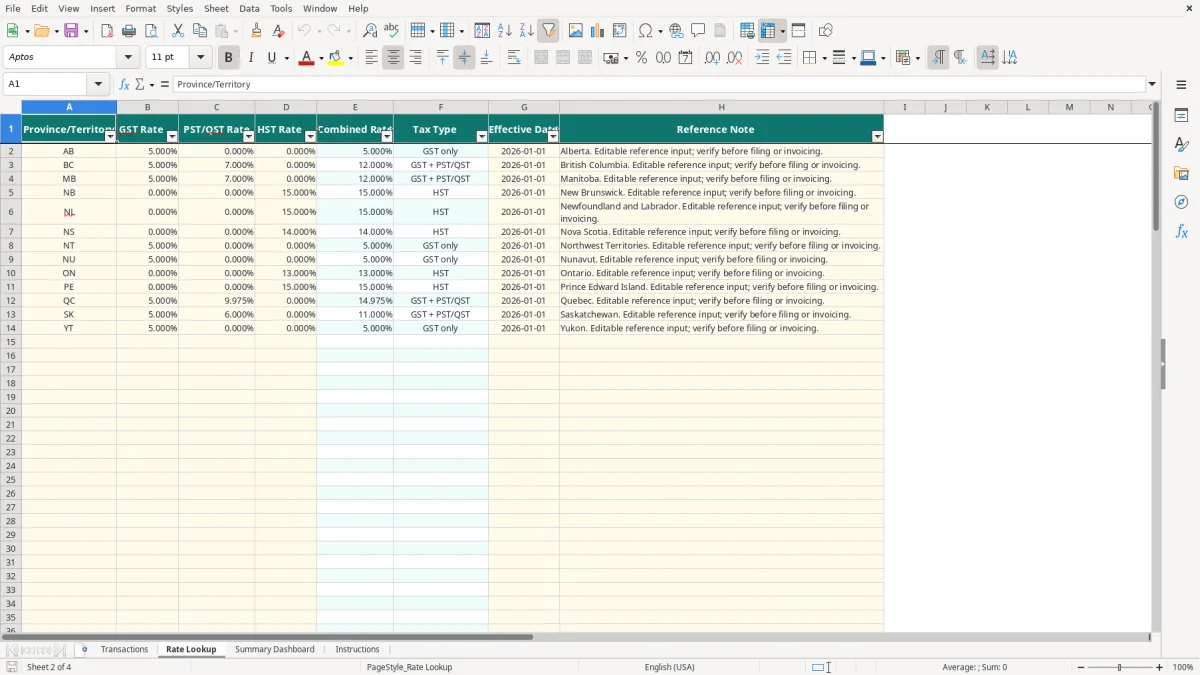
Image 2 shows the Rate Lookup sheet, where each province or territory has separate GST Rate, PST/QST Rate and HST Rate fields. The Combined Rate and Tax Type columns are calculated, so you can see whether a row is treated as HST, GST plus PST/QST or GST only.
Use the file after each invoicing run, then review it before a GST/HST filing or fiscal year-end handoff. It is best suited to a small operation with up to 100 prepared transaction rows; a business processing thousands of sales should export summarized data from its accounting or point-of-sale system instead of typing every order here.
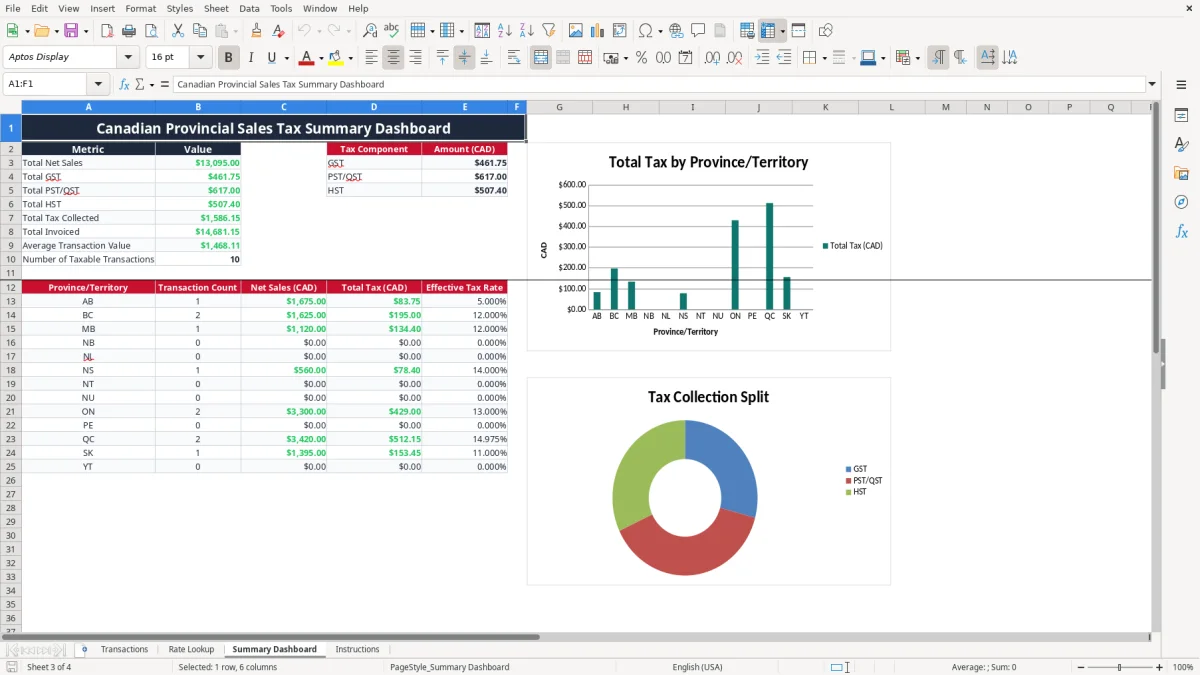
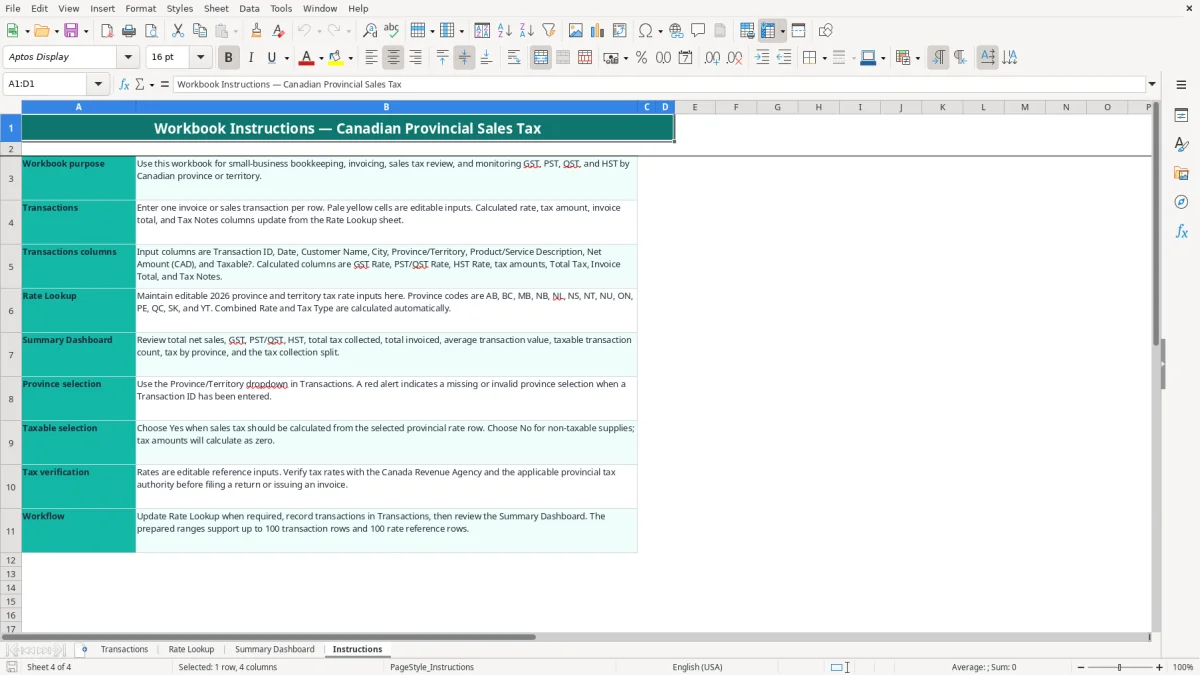
Image 3 shows the Summary Dashboard. It presents total net sales, GST, PST/QST, HST, total tax, total invoiced, average transaction value and a province table. Image 4 shows the Instructions sheet, which explains the intended workflow and warns you to verify rates before filing or invoicing.
The workbook separates the federal GST from provincial sales taxes and HST. The federal GST rate is 5%; HST is 13% in Ontario and 15% in New Brunswick, Newfoundland and Labrador, Nova Scotia and Prince Edward Island. British Columbia, Manitoba and Saskatchewan use GST plus a provincial tax in the rate structure represented by the sheet, while Quebec uses GST plus QST.
These are reference inputs, not a filing determination. The Rate Lookup sheet is editable and dated 2026-01-01 in the prepared rows, but the Instructions sheet specifically tells you to verify rates with the CRA and the applicable provincial authority before issuing an invoice or filing a return.
For most businesses, mandatory GST/HST registration begins when worldwide taxable revenue exceeds $30,000 over four consecutive calendar quarters, or immediately when it exceeds $30,000 in a single quarter. A registrant generally uses a business number with an RT program account for GST/HST; an incorporated business may also have an RC corporate income tax account and an RP payroll account.
For example, a contractor with four employees might bill $8,000 in January, $9,500 in February, $12,000 in March and $7,000 in April. The first three months total $29,500, but adding April pushes the four-month period to $36,500, so the registration analysis cannot be postponed until year-end.
Keep invoices, contracts, shipping evidence and tax calculations for the CRA's six-year record-retention period. The spreadsheet helps organize output, but it does not decide place of supply, taxability, input tax credits or special rules for real property, digital services or sales into another jurisdiction.
A sole proprietor normally reports business activity on a T2125 with the personal T1 return, while a corporation files a T2. Use the spreadsheet as a transaction support schedule, then reconcile its totals to the general ledger and the amounts reported on the relevant GST/HST or provincial return.
The most expensive error is often not a bad multiplication formula; it is choosing the wrong province. A business may use its own office address for every invoice even when the customer, delivery destination or place-of-supply facts point elsewhere. On $50,000 of taxable sales, a 2% rate difference creates a $1,000 discrepancy before interest, corrections and customer follow-up.
Another recurring problem is treating HST as GST plus PST/QST in separate columns when the applicable regime requires HST, or adding a provincial tax to a non-taxable supply. The Transactions formulas keep the components distinct according to the selected Rate Lookup row, but they cannot correct an incorrect rate table or an incorrect Taxable? selection.
For instance, a $2,480 equipment sale entered as QC with Yes retrieves the Quebec row. If someone changes the province to ON merely because the seller is located in Ontario, the calculated tax may still look reasonable while the invoice records the wrong jurisdiction. That mistake can affect both the customer charge and the seller's return.
Rows with a Transaction ID but no province produce Verify province selection in Tax Notes. Rows marked No produce Non-taxable supply and zero tax amounts. Do not replace the formula columns with typed amounts: copying a $125 tax figure from one invoice into another can silently distort the dashboard.
There is also a capacity trap. The workbook has formulas through row 101, meaning 100 operational transaction rows, and the dashboard sums those same ranges. Pasting transaction 101 below the prepared area will not automatically extend the formulas or summary totals. A 300-order month therefore needs a controlled split, an expanded copy of the formulas and dashboard ranges, or a more suitable system.
Finally, a rate table is not evidence by itself. Keep the source, effective date and supporting invoice documentation; the workbook's Reference Note is a prompt to verify, not a substitute for the legislation or authority guidance.
Set one fixed review point after the last invoice of each week and a second review before the GST/HST filing deadline. The practical choice is to enter transactions during invoicing, not at quarter-end: ten rows checked every Friday are easier to correct than 120 rows reconstructed from bank deposits.
Image 1 is designed for quick entry because the input columns are grouped before the calculated columns. Image 3 is the control point: compare its province totals with your invoice listing, then investigate an effective tax rate that does not match the expected jurisdiction.
The workbook already uses data validation for province codes and Yes/No taxable selections, plus conditional formatting for entry warnings. Keep those controls in place. If you add rows, copy the entire formula pattern in columns I:Q and extend the Summary Dashboard SUM, COUNTIF and SUMIF ranges together; extending only one part creates incomplete reporting.
The file is a good fit for a small business with 100 or fewer prepared transaction rows and a straightforward sales process. Move to accounting, point-of-sale or tax software when you have several hundred orders per month, multiple users editing simultaneously, credit notes and returns, inventory integration or tax reporting that must be generated directly from source transactions.