
Maternity Top-Up Excel Template – Free (2026)
2
Free download
Track Canadian ferry voyage costs by vessel, route, province and category, with tax calculations, budgets, unit costs and a management dashboard.
Download template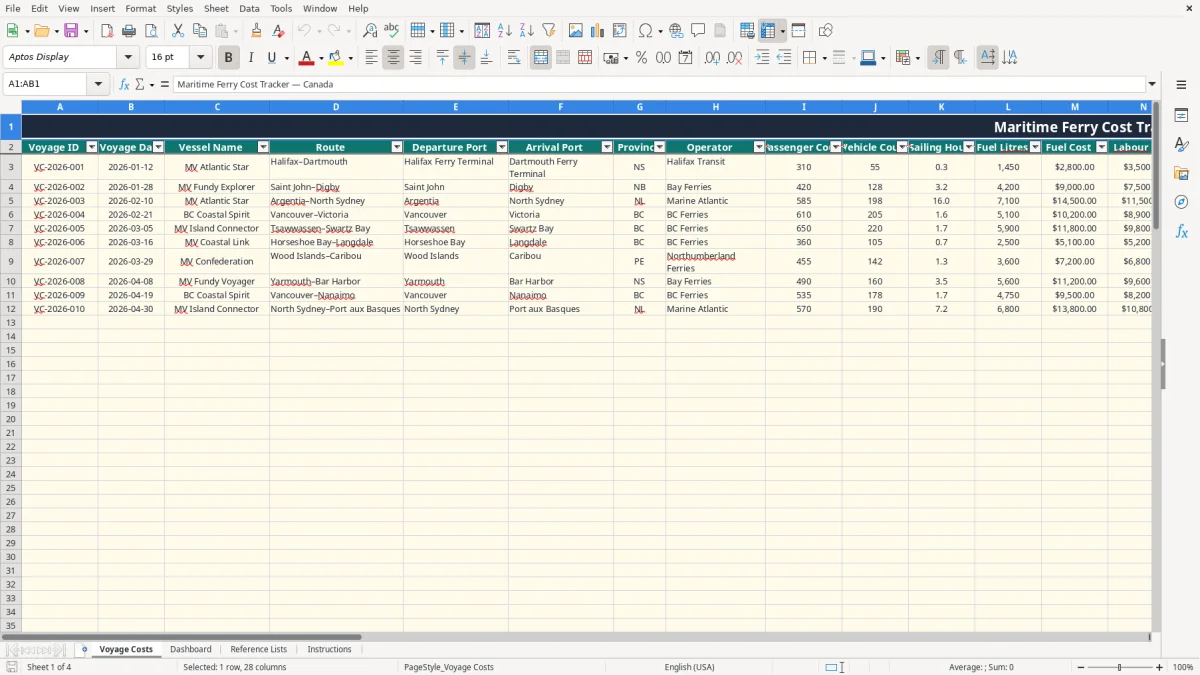
This maritime ferry cost Excel template records one sailing per row and calculates operating cost from fuel, labour, maintenance, port fees, catering and other expenses. It contains 100 prepared voyage rows, provincial tax lookups, passenger and vehicle unit costs, budget variance, status checks and a management dashboard.
Enter your operational data on the Voyage Costs sheet. Image 1 shows the editable voyage table, while the calculated columns produce subtotal, tax, total cost, cost per passenger, cost per vehicle and budget status automatically.
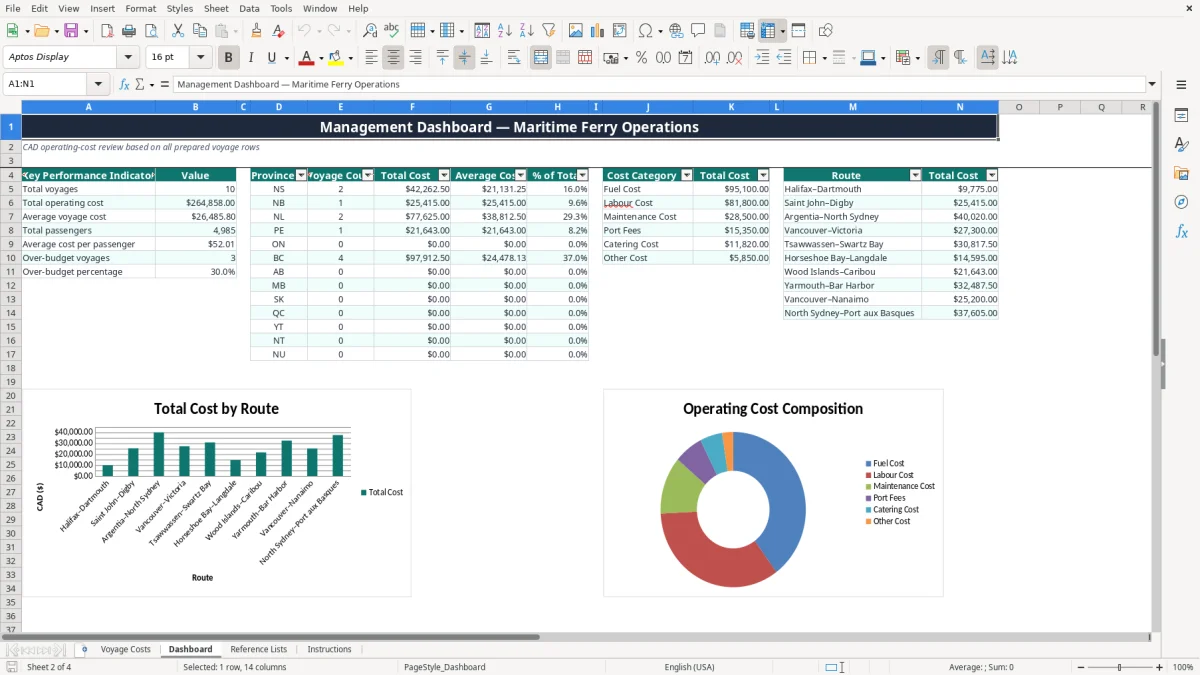
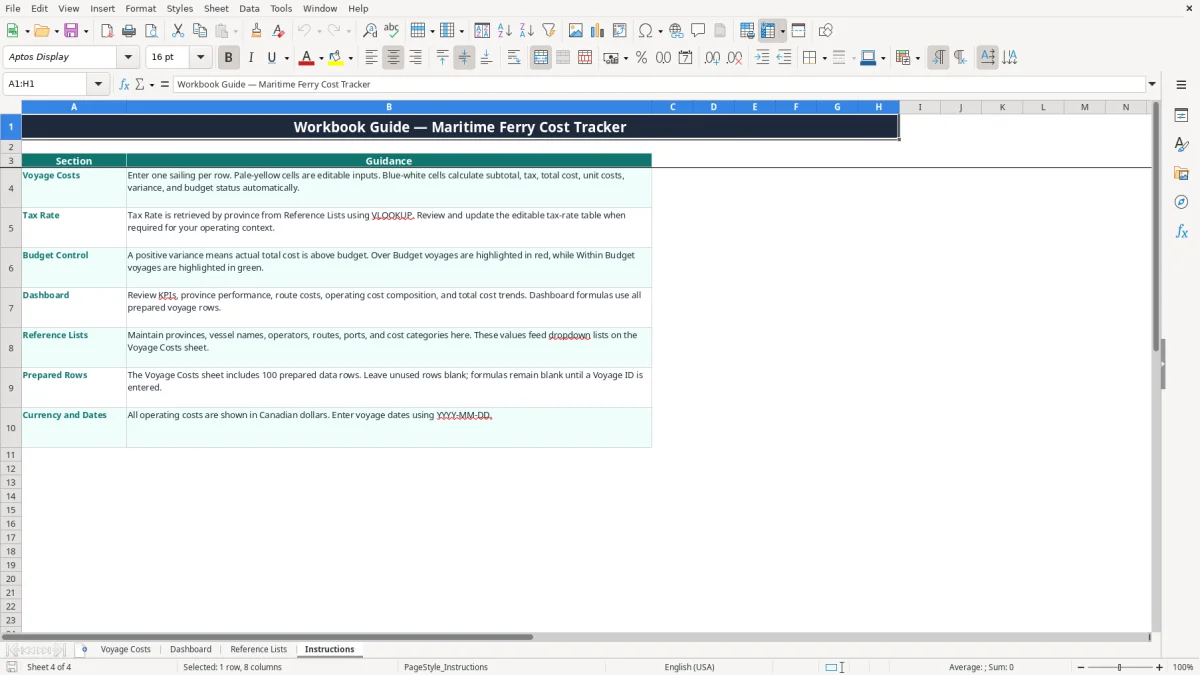
The Dashboard sheet in image 2 summarizes voyage counts, operating costs, provincial results, cost categories and routes. Reference Lists and Instructions, shown in images 3 and 4, support dropdowns, tax-rate maintenance and day-to-day use.
A ferry operations manager can use this workbook during each sailing cycle to record the costs behind a route instead of waiting for month-end totals. The Voyage Costs sheet is suited to municipal transit, regional ferry operators and private services that need to compare vessels, crossings and provincial operations in Canadian dollars.
Image 1 shows the table from Voyage ID through Notes. A short Halifax–Dartmouth trip might record 310 passengers, 55 vehicles, 0.3 sailing hours and 1,450 litres of fuel. A longer Saint John–Digby sailing can be entered on the next row with 420 passengers, 128 vehicles, 3.2 hours and 4,200 litres.
Those rows are not forecasts: the workbook includes them as populated sample data. The remaining prepared rows are available for your own voyages, and formulas stay blank until you enter a Voyage ID.
Image 2 shows KPI values and summary tables rather than an entry form. The Dashboard uses COUNTA, COUNTIF, SUMIF and SUM to group populated rows by province, route and cost category.
For example, if four employees support a sailing and labour costs total $3,500, you can compare that amount with fuel and port charges without combining separate worksheets. The dashboard also reports average cost per voyage, so a $12,000 short crossing and a $29,000 overnight crossing are not treated as though they have the same operating profile.
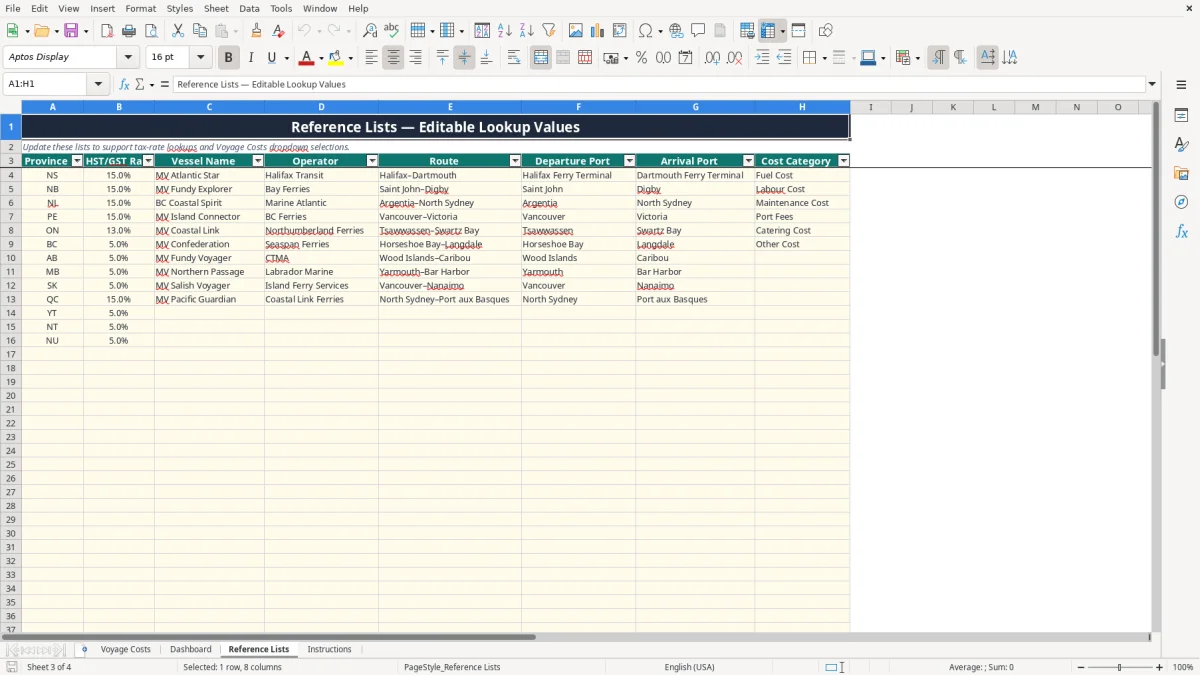
The workbook's Reference Lists sheet contains sample rates of 15% for Nova Scotia, New Brunswick, Newfoundland and Labrador and Prince Edward Island, and 13% for Ontario. These are the HST rates shown in the file; update the table when the tax treatment for your operating context changes.
When you select a province in column G, the Tax Rate column uses VLOOKUP against Reference Lists. If a row has a $10,000 subtotal and a 15% rate, Tax Amount is $1,500 and Total Cost is $11,500. At 13%, the same subtotal produces $1,300 tax and $11,300 total.
The workbook does not decide whether a particular ferry charge is taxable, whether an input tax credit is available, or whether an operator should use the regular GST/HST method or the Quick Method. Those are tax-reporting decisions, and the rate table should be reviewed before a filing.
A registered operator should retain invoices, fuel receipts, payroll support, port statements and maintenance records with the voyage data. The CRA generally expects business records to be retained for six years. A business operating across provinces should also distinguish GST 5%, HST 13% in Ontario and HST 15% in the Atlantic provinces from provincial charges such as PST or QST.
For a registered business, the tax account is normally linked to the BN through an RT program account. This tracker is an operating-cost analysis tool, not a GST/HST return: reconcile its tax totals to the actual invoices and accounting records before filing.
The most expensive errors usually begin with inconsistent voyage rows. One supervisor enters MV Atlantic Star, another enters Atlantic Star, and a third leaves the vessel blank. The dropdowns in Image 1 reduce that problem, but only if the lists on Reference Lists are maintained instead of typing over the controlled choices.
A wrong province can change a $20,000 subtotal by $400: 15% HST is $3,000, while 13% HST is $2,600. The workbook retrieves the rate from the province selection, so a wrong province creates a calculated answer that looks precise but is still wrong.
Budget errors are equally practical. If actual voyage cost is $18,750 and the budget is $17,000, Variance is $1,750 and Status becomes Over Budget. Entering the budget as $170,000 hides the issue by a factor of ten, while leaving it blank makes the variance comparison unhelpful.
Passenger and vehicle counts must describe the same sailing as the costs. A $24,000 voyage divided by 600 passengers gives $40 per passenger; dividing by a copied count of 300 gives $80. The formulas return zero when the denominator is zero, but they cannot detect a plausible count copied from the wrong departure.
Another common failure is overwriting a blue-white calculated cell with a hard-coded number. That breaks the chain from cost inputs to Total Cost and Dashboard summaries. Keep editable inputs in the pale-yellow cells described on Instructions, and test a completed row against the supporting invoices before using it in a management report.
The easiest routine is to complete the row shortly after each sailing, while the fuel ticket, labour record and port invoice are still available. A ferry operator running 10 voyages a week can spend five minutes per row on the same day rather than reconstructing 40 rows at month-end.
Use the Reference Lists sheet as the control point for new vessels, operators, routes and ports. If a route name changes, update the list before entering new rows; otherwise the Dashboard route summary can split one service across two spellings.
This file has 100 prepared Voyage Costs rows, not an unlimited database. At 25 sailings per week, that is roughly four weeks of entries before you need to archive or extend the workbook. For a fleet with multiple dispatchers, live fuel feeds, purchase-order matching or several thousand voyages, move to an accounting or fleet system and preserve this workbook as an analysis export.
Keep a locked monthly copy after review. A practical file name is FerryCosts-2026-03.xlsx, followed by a reconciliation note showing the Dashboard total and the accounting-system total. If the two figures differ by $2,000 on $100,000 of monthly costs, investigate before approving the report rather than carrying the difference forward.